
Customer journeys rarely move in a neat line from “awareness” to “purchase”. They loop, pause, and restart across devices and channels. That messiness matters because small changes in journey behaviour can have large commercial consequences. For example, IRP’s market data shows average e-commerce conversion rates around the ~2% range (e.g., 1.99% in December 2025, down from 2.18% the year before). When conversion is that sensitive, understanding how people transition between behaviours is more useful than counting page views. This is where Hidden Markov Models (HMMs) offer a disciplined way to map “states” customers move through—even when those states are not directly observable.
1) What an HMM adds beyond funnels and click-paths
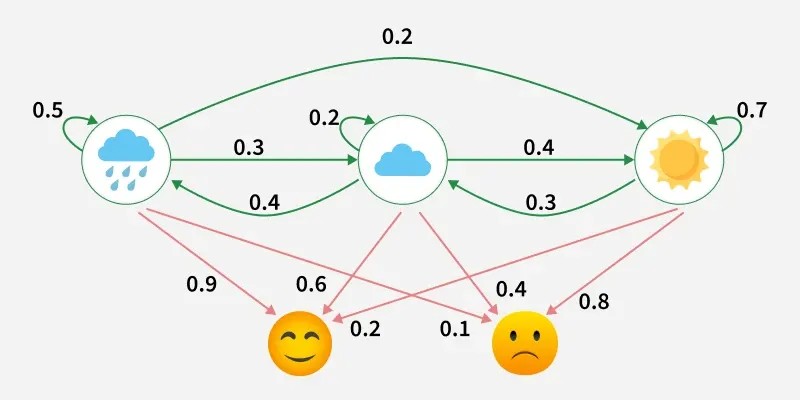
An HMM is a model where the customer is assumed to be in a hidden (unseen) state at any moment, and you only observe signals (clicks, sessions, purchases, support contacts). The model learns two things:
- Transition probabilities: how likely customers are to move from one hidden state to another (for example, from “browsing” to “evaluating”).
- Emission probabilities: what observed actions are likely in each hidden state (for example, “pricing-page visit” might be common in “evaluating”).
The “Markov” part means the next state depends mainly on the current state, not the entire distant past—an assumption that keeps the model practical while still capturing meaningful sequences.
This framing is a useful corrective to funnel thinking. Funnels label stages by business preference (“consideration”), but HMMs label states by behavioural evidence (“high-intent comparison”, “friction loop”, “post-purchase support”). That makes the output more actionable for product and growth teams.
2) How you build customer journey states from real behavioural data
A practical HMM workflow looks like this (and it’s the kind of modelling mindset a solid data analytics course in Mumbai should help you apply, not just memorise):
Step A: Define the observation sequence
Pick events that represent intent and friction, not every possible click. Examples: session start, product view, search, add-to-cart, checkout start, payment failure, purchase, return, support ticket. Keep timestamps so you can model sequences over time.
Step B: Choose the “state vocabulary”
You do not directly label hidden states; the model learns them. But you choose how many states to allow (often 3–8 to start). Too few states oversimplifies; too many becomes hard to interpret.
Step C: Train and decode
Training typically estimates transition and emission probabilities using iterative procedures (commonly known in HMM literature as Baum–Welch). Then you can “decode” the most likely hidden state sequence for each customer using an algorithm like Viterbi (in plain terms: it finds the most probable path of states that explains the observed actions).
Step D: Validate with business-grounded tests
Do the learned states predict something that matters (conversion, churn, repeat purchase) on holdout data? If “high-intent evaluation” does not correlate with higher conversion later, the state definition or observations may be off.
3) What you actually get from HMM-based journey analytics
The strongest outputs are not “a model score”; they are behaviour maps.
A transition map you can act on
You can identify the highest-probability pathways and the “leak points”. For example:
- “Evaluating → friction loop → exit” might highlight checkout usability or payment reliability issues.
- “Browsing → evaluating → purchase” might identify what a healthy journey looks like.
Early warning signals
HMMs can flag customers who enter a risky state (for example, repeated price checks plus abandoned checkout attempts) even before churn is visible in revenue.
A more realistic view of multi-touch journeys
Marketing and product teams often want to know how sequences of touchpoints shift customer momentum. Research literature discusses using HMMs in marketing to model transitions among latent (hidden) customer states and how actions can affect those transitions. This is a better match for reality than treating each touchpoint as independent.
A useful editorial point here: organisations often say they want “customer centricity”, but customer paths are non-linear and fragmented—so the measurement approach needs to reflect that. HMMs do, by design.
4) Use cases and practical pitfalls you should plan for
Use case 1: Subscription churn prevention
States might include “habit formed”, “value drop”, and “at-risk”. Transitions help you decide whether to intervene with education, feature prompts, or service recovery—and when.
Use case 2: Marketplace or retail conversion improvement
If the model learns a “comparison trap” state (lots of views, no cart adds), it may signal missing product information, weak reviews, or unclear pricing.
Use case 3: Fintech onboarding
States can reflect “confused verification”, “stuck KYC”, or “ready to transact”. Mapping transitions helps quantify which bottlenecks cause drop-offs.
Pitfall: interpreting states as “truth”
Hidden states are useful abstractions, not psychological facts. Name them carefully and tie the label to what the emissions actually show.
Pitfall: journey drift
When product UX or marketing mix changes, transition probabilities change too. Re-train on recent windows and compare state definitions over time.
Pitfall: privacy and data minimisation
Journey modelling often involves personal data. Keep observation features necessary and proportionate, and ensure access controls and auditability if the data is sensitive.
Conclusion
Funnels describe what you wish customers would do; HMMs model what customers actually do: move between behavioural states over time, leaving observable traces that can be analysed. With conversion benchmarks hovering around ~2% in many markets, the value of understanding state transitions is not theoretical—it can directly affect revenue and retention. A strong data analytics course should teach this as a practical discipline: define meaningful observations, learn interpretable states, validate against outcomes, and monitor drift. And if you are applying these ideas locally through a data analytics course in Mumbai, the core standard remains the same—use the model to make journey behaviour measurable, explainable, and operationally useful, without overselling what “hidden states” can prove.
Business Name: Data Analytics Academy
Address: Landmark Tiwari Chai, Unit no. 902, 09th Floor, Ashok Premises, Old Nagardas Rd, Nicolas Wadi Rd, Mogra Village, Gundavali Gaothan, Andheri E, Mumbai, Maharashtra 400069, Phone: 095131 73654, Email: elevatedsda@gmail.com.